What Is the No-Show Rate? Definition, Formula, and 2026 Benchmarks by Event Type
TL;DR — Key Takeaways
- 1The no-show rate is the percentage of registered attendees who do not show up to the event. Formula: (No-shows ÷ Total registrations) × 100
- 22026 industry benchmarks vary widely by event type: paid in-person conferences run 10-30% no-show rates, free events run 40-60%, virtual events run 50-70%, and nonprofit galas typically run 5-15% (high social commitment)
- 3No-show rates have been trending upward across most event categories since 2023 — virtual fatigue, calendar saturation, and weaker pre-event communication are the most-cited causes
- 4The biggest lever to reduce no-shows is pre-event communication beyond email: AI voice confirmation calls reach 85-90% of registrants, vs ~20% email open rates
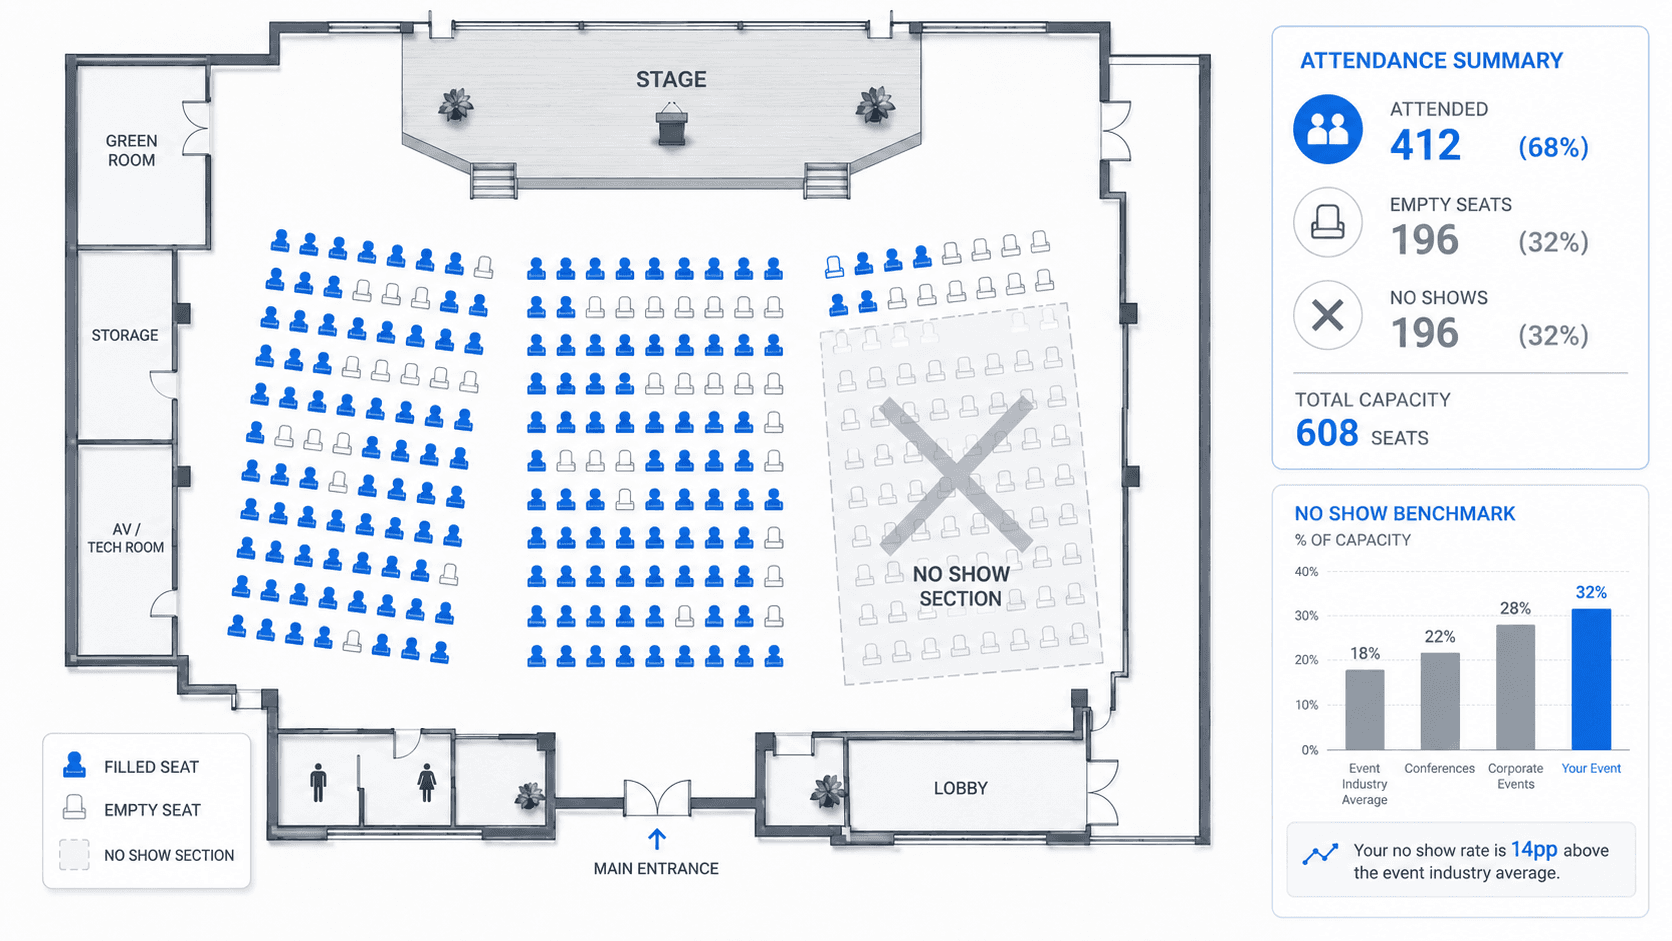
- 5No-show rate is not a vanity metric — at a 32% no-show rate on a 500-person conference with a $150,000 budget, the quantifiable cost is over $47,000 per event in wasted catering, sponsor value, and operations
Most event teams know roughly what their no-show rate is. Most don't track it deliberately, and almost none benchmark it against the right reference. This guide fixes that.
It covers the definition, the formula, and current 2026 benchmarks across event types — plus what actually moves the number.
Definition: What is the no-show rate?
The no-show rate is the percentage of registered attendees who do not show up to an event.
It's the most direct measure of whether the people who said they were coming actually came. Every other event success metric — sponsor ROI, NPS, content attendance, networking density — assumes the room is full. The no-show rate is the metric that determines whether that assumption holds.
The term is used identically in events as it is in healthcare (patient no-shows), restaurants (reservation no-shows), and hospitality (room no-shows). The math is the same; only the stakes change.
Formula: how to calculate the no-show rate
No-show Rate = (No-shows ÷ Total Registrations) × 100
Where:
- Total Registrations = the count of confirmed registrants as of the event date
- No-shows = Total Registrations − Actual Attendance
- Actual Attendance = the number of people who checked in (in-person) or logged in (virtual)
Worked example
A conference has 500 registrations. At check-in, 340 people walk through the door.
- No-shows = 500 − 340 = 160
- No-show Rate = (160 ÷ 500) × 100 = 32%
This is roughly the industry average for paid in-person conferences in North America.
Things that throw the calculation off
A few common pitfalls:
- Cancellations vs no-shows. Most teams count cancellations (formal "I can't make it" notifications) separately from no-shows. The cleanest definition is: no-show = registered + did not cancel + did not attend. Cancellations have their own metric.
- Walk-ins. If your event allows walk-ins, attendance can exceed registrations. The no-show rate calculation should still use the registered-only attendance number in the denominator.
- Multi-day events. No-show rate at registration vs no-show rate by day. Most teams report no-show rate at registration (did the person ever attend?) and session attendance rate separately (what percentage of registered sessions were attended?).
- Virtual logins vs engagement. A login isn't necessarily an "attendance." Some teams use a 5-minute or 15-minute minimum engagement threshold for the attendance count.
2026 benchmarks by event type
These are the bands we see across North American events in 2026. Where you sit within the band depends primarily on your pre-event communication discipline.
Paid in-person conferences: 10-30%
Industry average sits around 25-32%. The band is wide because pre-event communication varies dramatically between operators. Teams running multi-channel pre-event sequences (voice + SMS + AI chat) consistently land at the 10-15% end. Teams relying on email-only land at 30-40%.
Free in-person events: 40-60%
The largest no-show category. Free registration carries almost no psychological commitment, so the rate naturally runs high. Adding even a small refundable deposit ($3-$25) typically drops this band to 14-25% — the commitment effect is much larger than the dollar amount would suggest.
Virtual events (paid): 35-55%
Lower friction to register and to skip. Even paid virtual events see meaningfully higher no-show rates than equivalent in-person events. The 5-minute attendance threshold matters here — some "attendees" log in for 30 seconds and leave.
Virtual events (free webinars): 50-80%
The highest no-show band of any event category. Free webinar registration is essentially a calendar bookmark. Most virtual marketers expect 30-50% of registrants to show up; the rest receive the recording afterwards (and some genuinely intended to attend live but couldn't).
Hybrid events: split tracking
Hybrid events should be tracked as two separate cohorts — in-person attendees and virtual attendees — because the no-show rates run in different bands. A single combined no-show rate hides the fact that one side is performing well and the other isn't.
Nonprofit galas: 5-15%
The lowest no-show rates in the industry. Nonprofit galas typically involve named seats, social commitment, and significant donor investment — all of which create strong attendance pressure. A 5-10% no-show rate is typical and reflects the depth of the relationship in the registration.
Corporate galas, board events, summits: 5-12%
Similar to nonprofit galas. Senior audiences, named invitations, and reciprocal social commitment all keep no-show rates low. These events typically fail due to no-show only when communication breaks down completely.
Trade shows and expos: 35-50%
Higher than paid conferences because expo registration is often a "maybe" decision rather than a committed plan. The teams that drive booth visits effectively typically have lower no-show rates because pre-event programming gives attendees a specific reason to attend.
Why have no-show rates been climbing
Most event categories have seen no-show rates trend upward since 2023. The most-cited drivers:
- Virtual fatigue. Lower-commitment virtual registration habits carry over to in-person events.
- Calendar saturation. Hybrid work means more meetings, less margin for half-day or full-day event attendance.
- Weaker pre-event communication. Email open rates have dropped meaningfully since 2022. Teams relying on email-only reach a smaller percentage of registrants each year.
- Less willingness to travel. Even fully-paid corporate event attendees more readily skip travel commitments than they did pre-2020.
The teams that have moved against this trend share a common pattern: they communicate across multiple channels (voice, SMS, chat) rather than email-only.
The cost of a no-show
A 32% no-show rate is not just a number. On a 500-person conference with a $150,000 event budget, the no-show cost compounds:
- Catering waste: 160 unused meals at $75 each = $12,000
- Sponsor under-delivery: sponsors paid for 500 reach, got 340. Roughly $20-30K in adjusted ROI promises
- Venue underutilization: rented and paid for capacity that didn't fill = ~$10K equivalent
- Inflated per-attendee cost: $150K budget ÷ 340 attendees = $441/attendee instead of $300/attendee
- Reputational cost: half-full rooms damage future registrations
Combined, a 32% no-show rate at this scale represents $47,000+ in quantifiable cost per event, plus harder-to-measure reputational damage. For the full cost-of-no-shows analysis, see our no-show cost breakdown.
How to reduce your no-show rate
There are five proven levers, ordered by impact:
1. Add pre-event voice confirmation calls
AI voice calls, or human callers, reach 85-90% of registrants in the final 7-14 days before the event. This is the single highest-leverage move you can make. Typical impact: 20-30% reduction in no-shows.
2. Layer SMS reminders 48 hours and morning-of
SMS open rates are 98% vs ~20% for email. The last-mile reminder channel that catches the registrants who never opened the email sequence.
3. Deploy an AI chat agent for pre-event questions
Most registrants have 2-3 questions in the final week. An AI chat trained on your event's specifics answers them instantly and surfaces last-minute concerns to your team.
4. Add a small refundable deposit (for free events)
$3-$25 refundable deposits drop free-event no-show rates from 40-60% to 14-25%. The mechanism is psychological commitment, not the money itself.
5. Send a logistics packet within minutes of registration
Venue map, parking, dress code, arrival window, calendar invite. Sets the tone and creates calendar entries that compete for attention as event day approaches.
For the full playbook with implementation details, see our 10 proven ways to reduce event no-shows.
What to track alongside the no-show rate
The no-show rate is most useful in context with two other metrics:
- Contact rate — % of registrants successfully reached via your pre-event communication
- Day-of inquiry volume — number of inbound questions received in the 24 hours before and during the event
These three together form the operational picture: how many of the registered attendees you actually reached, how many showed up, and how stretched your team was on event day. Optimising one in isolation doesn't move the others. Optimising all three together is the difference between events that fill and events that leak.
For the full attendance metrics framework, see Measuring What Matters: From Registration to Real Attendance.
How AI changes the math
The 2026 shift worth noting: AI voice and chat agents now make multi-channel pre-event communication possible at any event size. Where previously the 500-person event team couldn't realistically call every registrant, AI voice agents can run that outreach automatically — at 85-90% contact rates and at a cost that scales linearly per agent.
The teams running this consistently are pulling no-show rates down 20-30% below their previous baselines. The math has changed; the metric hasn't.
For a closer look at how AI plugs into event attendance specifically, see Kairos — our AI communication platform.
Quick reference: 2026 no-show benchmarks
- Event type: Paid in-person conferences · Typical no-show range: 25-32% · Strong performance: <20%
- Event type: Free in-person events · Typical no-show range: 40-60% · Strong performance: <35%
- Event type: Virtual events (paid) · Typical no-show range: 35-55% · Strong performance: <40%
- Event type: Virtual webinars (free) · Typical no-show range: 50-80% · Strong performance: <50%
- Event type: Nonprofit galas · Typical no-show range: 5-15% · Strong performance: <10%
- Event type: Corporate galas/summits · Typical no-show range: 5-12% · Strong performance: <8%
- Event type: Trade shows/expos · Typical no-show range: 35-50% · Strong performance: <30%
If your event runs above the typical range for its category, the highest-impact first step is usually adding pre-event voice + SMS to whatever communication you're already running. The teams that close the gap between registration and attendance start with channel mix, not content.
Related reading: The $47,000 Problem: What Event No-Shows Actually Cost · 10 Proven Ways to Reduce Event No-Shows · The Complete Guide to Event Attendee Lifecycle Management · Measuring What Matters: From Registration to Real Attendance
Frequently Asked Questions
What is the no-show rate?
The no-show rate is the percentage of registered event attendees who do not show up. It's calculated as (No-shows ÷ Total registrations) × 100. For example, if 500 people register and 340 attend, the no-show rate is 32% — meaning 160 of 500 registrants did not show up. The no-show rate is a critical event metric because it directly affects catering costs, sponsor ROI, room utilisation, and the energy of the event itself.
How do you calculate no-show rate?
The formula is: No-show Rate = (Number of No-shows ÷ Total Registrations) × 100. To calculate yours, you need two numbers: the total number of registrations as of the event date, and the actual attendance (check-ins for in-person, logins for virtual). Subtract attendance from registrations to get no-shows, then divide by total registrations and multiply by 100. Example: 800 registrations, 560 attended → (800 - 560) ÷ 800 × 100 = 30% no-show rate.
What is a good no-show rate for an event?
A 'good' no-show rate depends on the event type. For paid in-person conferences, anything under 20% is strong. For free in-person events, under 35% is strong (industry average is 40-60%). For virtual events, under 40% is strong (industry average is 50-70%). For nonprofit galas with deep social commitment, the typical benchmark is 5-15%. Below these thresholds, you're outperforming peers. The biggest predictor of low no-show rates is multi-channel pre-event communication — not registration fee level alone.
Why is the no-show rate so high at free events?
Free events run higher no-show rates because the psychological commitment of a free registration is much lower than paid. A registrant who paid $300 has skin in the game — they'll move other commitments to attend. A registrant who clicked a button for free has no real switching cost. Industry data consistently shows that adding even a small refundable deposit ($3-$25) drops free-event no-show rates from 40-60% to 14-25%. The mechanism is commitment, not the money.
What's the average no-show rate for virtual events?
Virtual event no-show rates run 50-70% on average — meaningfully higher than in-person. The lower friction of virtual registration (one form, one click) and lower social commitment (no travel investment, no public no-show signal) explain most of the gap. Some categories run higher: free virtual webinars routinely see 60-80% no-show rates. Pre-event communication matters even more for virtual events because of the lower baseline commitment.
How can you reduce the no-show rate?
The biggest single lever is multi-channel pre-event communication that goes beyond email. AI voice confirmation calls reach 85-90% of registrants vs ~20% email open rates. The strongest playbook combines: immediate logistics packet within minutes of registration, voice confirmation 7 days out, SMS reminder 48 hours and morning-of, and an AI chat agent for inbound questions. Adding a small refundable deposit ($3-$25) also drops no-show rates substantially for free events. Most teams see a 20-30% reduction in no-shows when they execute this consistently.
Hemal Shah is the Co-Founder of KNVI Labs. Hemal co-built the attendee lifecycle communication framework behind Kairos after identifying that most event teams lose attendance at five predictable moments — not randomly. Hemal writes about event economics, AI communication systems, and the operational patterns behind attendance optimization.
Run one event with Kairos. See the difference.
Voice, SMS, and chat agents across your full event lifecycle — pre-event, day-of, and post-event. Pilots launch in 5 days with zero technical lift.